Over the past two years, 165,000 more Americans have died of natural causes, such as diabetes and hypertensive heart disease, than historical norms would lead researchers to expect, according to a new analysis of U.S. Centers for Disease Control and Prevention data from a team of demographers at Boston University and the University of Pennsylvania.
A smaller group of deaths from specific natural causes that the CDC has identified as potentially COVID-19-related shows a similar figure: 158,212 additional deaths during the pandemic than in the previous two years, as of last week.
These groupings of “excess” natural cause deaths are likely a step closer to the true toll of the pandemic than official tallies reveal, and would add as much as 15% percent to the closely-watched 1 million official COVID-19 death figure, as put forward by the CDC and other public health experts.
Our new data repository includes the modeled estimates and CDC mortality data at the county level covering 2020 and 2021, compiled and summarized by the Documenting COVID-19 project at Columbia University’s Brown Institute for Media Innovation and MuckRock. It will allow journalists and researchers to further probe these deaths to look for local and regional patterns.
The main source of the data is the CDC’s provisional mortality database, available through a query portal called CDC WONDER. The WONDER portal is extensive; building queries can be complicated and time-consuming. We signed a data-use agreement with the CDC to gain access to their API portal so we could gather more data, more often and provide it for others to use.
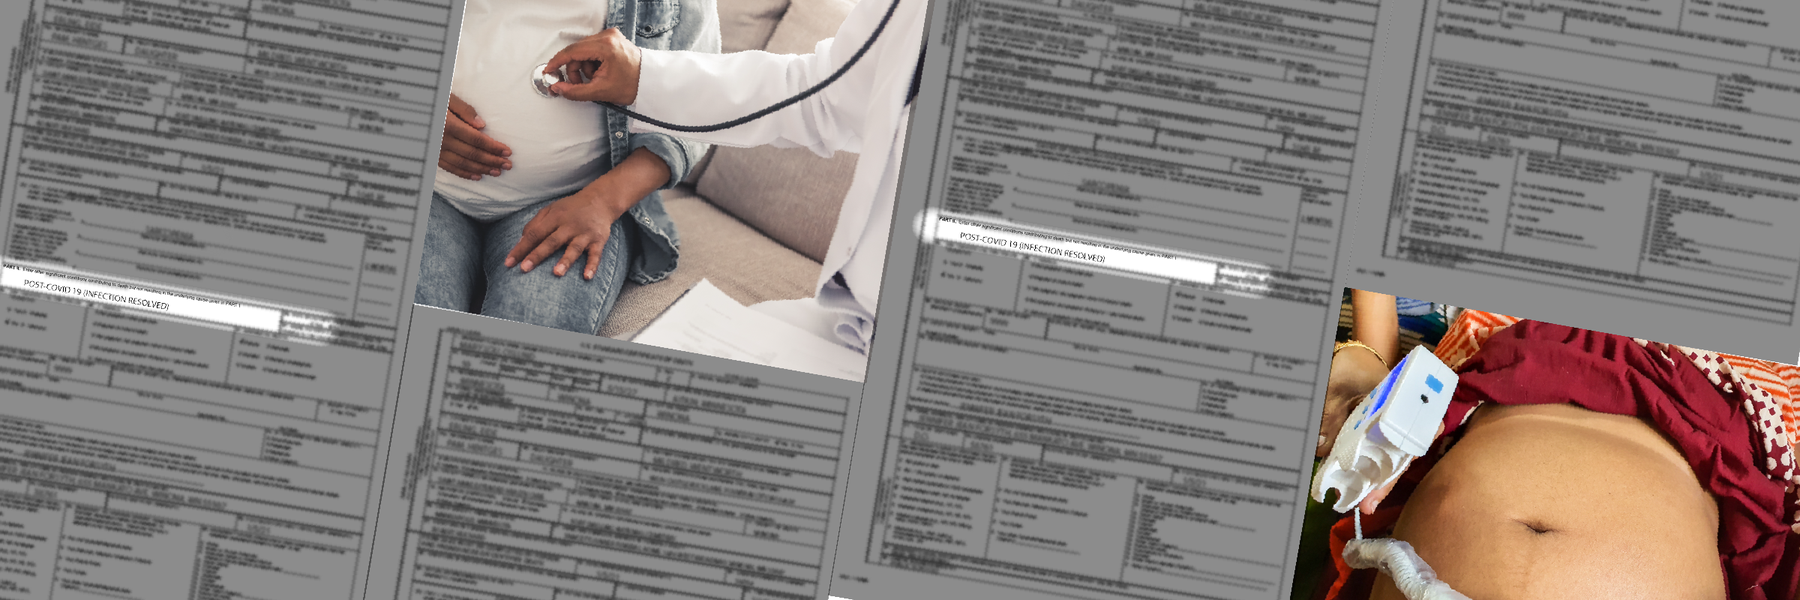
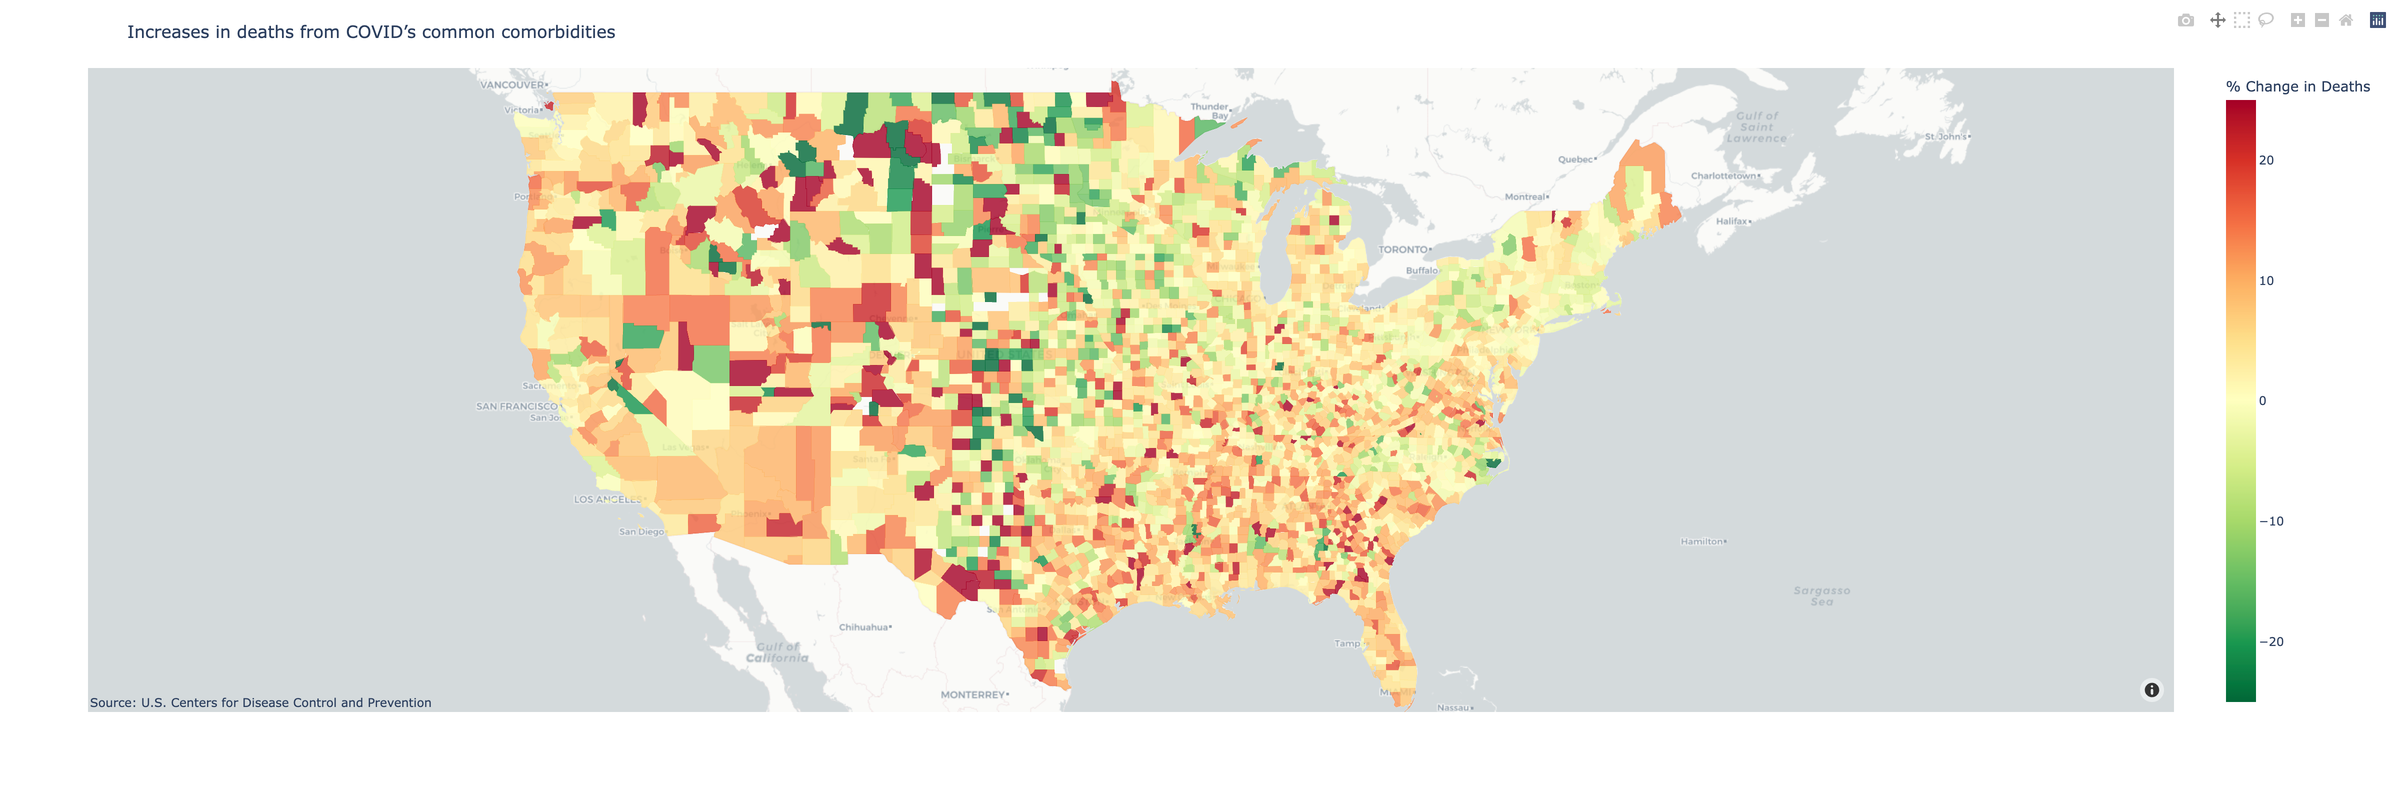
The CDC has categorized excess deaths from specific natural causes, like hypertensive diseases or diabetes, as deaths that “could represent misclassified COVID-19 deaths, or potentially could be indirectly related to COVID-19.” We’ve used their list of diseases in this category to query WONDER and provide totals for every county in the country.
The two maps above represent slightly different ways to measure excess deaths not directly attributed to COVID-19. It’s ultimately unclear how many of these deaths were the result of stretched hospital capacity and lack of access to healthcare during the pandemic, as opposed to “true COVID”-linked deaths that weren’t recorded correctly, researchers say.
Still, when looking at the numbers of excess deaths in 2021, the undercount of COVID-19 deaths is still a lingering phenomenon.
“We expected to see improvements in the accuracy of COVID-19 death tallies as the pandemic progressed but unfortunately issues with death certification have persisted into 2021,” said Andrew Stokes, a professor in the Department of Global Health at the Boston University School of Public Health whose team has supplied both data and models of county-level deaths for our journalism projects.
Teams of researchers across the globe have modeled excess deaths since the beginning of the pandemic with the ultimate goal of determining whether and where COVID-19 deaths are being undercounted. These studies predict national or state death figures, but don’t often don’t take into account county-level differences.
The pandemic’s larger impact on the country’s healthcare systems makes it difficult to pinpoint the true number of underreported COVID deaths, said Haidong Wang, an associate professor at the University of Washington’s Institute for Health Metrics and Evaluation who studies global excess mortality.
“COVID-19 stressed the healthcare system. People couldn’t get access to doctors or ICUs, and not having full access or reliable access to healthcare has an impact on mortality during the pandemic — and potentially in the long run,” Wang said.
The Uncounted series we launched with the USA TODAY network in late 2021 found that county and regional differences were critical factors in accounting for excess deaths. We found that short-staffed, undertrained and overworked coroners and medical examiners misclassified deaths that should’ve been attributed to COVID.
At the Documenting COVID-19 project, we’ve spent over a year analyzing data on what Americans have died of since the beginning of the pandemic. For our Uncounted investigation, we relied heavily on 2020 data because it takes several months to resolve reporting lags, leaving 2021 data unclear and incomplete. Now, as the true toll of COVID-19 in 2021 becomes clear, we want to help newsrooms and researchers continue to investigate deaths during the pandemic.
Our data repository includes some of what we consider the most important data points CDC’s WONDER tool has to offer for every county in the country:
-
Leading external causes of death in the 113 CDC code list, by underlying cause of death;
-
Natural causes of death associated with COVID-19, using the CDC’s categories for excess deaths associated with COVID, by underlying cause of death;
-
All deaths by race and ethnicity, with age-adjusted rate, regardless of underlying cause of death
You can use this data to hone in on your state or county, and you’ll find answers to some important questions there. Using the data, you can explore whether deaths from car accidents or drug overdoses increased during the pandemic, how increases in those deaths compare to deaths from natural causes like Alzheimer’s or diabetes or what race or ethnicity of people has died at higher rate in your community.
To help make sense of that data, you’ll find other information in the repository, including the excess mortality numbers modeled by demographers at Boston University, vaccination rates and a Department of Justice survey released in December of all medical examiner and coroner offices in the country.
We’ve also contributed to a library in the R programming language which makes querying CDC’s WONDER database easier, especially if you’re a researcher or journalist who’s been granted access to the API like we have.
This package wraps the long query parameters in precise and easy-to-read human language. Joyce Robbins, a lecturer in the Statistics Department at Columbia University, created and maintains the package, and has helped us add the new provisional WONDER database to her package with an option for authenticating county-level access.
“It’s really important to have open-source data, so we can access it, run our own analyses on it, graph it, visualize it and keep tabs on what we’re hearing from official sources,” Robbins said.
If you have any questions about the data or reporting, check out our reporting recipe or reach out to us at covid@muckrock.com.