The Clean Air Act is the primary U.S. federal air quality law dating back to the 1960s. Among other things, the law sets standards for concentrations of certain pollutants in outdoor air and, according to climate experts, is responsible for a substantial improvement in air quality since its inception. The Clean Air Act’s exceptional events rule was passed into law in 2005 and allows local air agencies to flag data from regulatory air monitors, for possible exclusion from federal air quality standards, when the pollution is caused by “natural” or “uncontrollable” events. The Environmental Protection Agency’s Air Quality System, or AQS, is a repository of all of the air pollution data that the federal government collects from monitors and regulatory stations across the country.
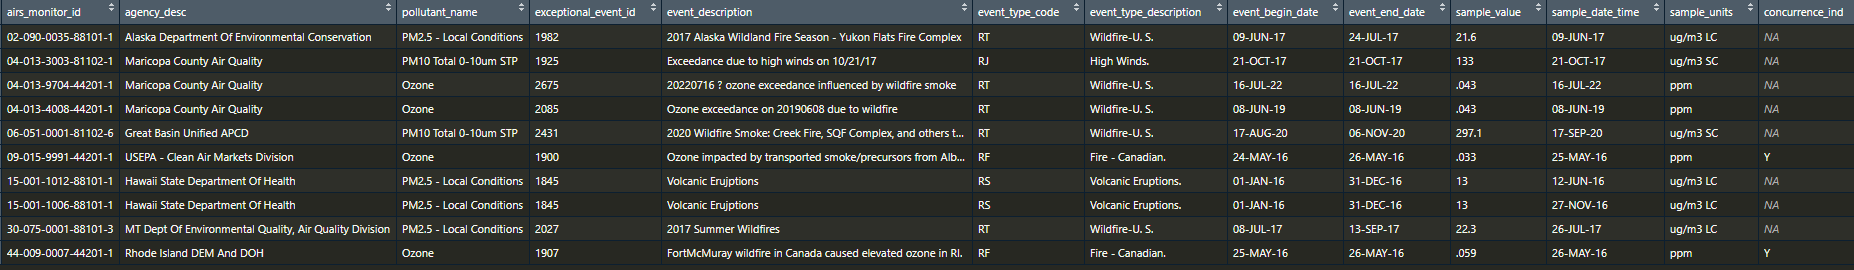
For its “Smoke, Screened,” project, MuckRock, The California Newsroom and the Guardian negotiated with the EPA to receive detailed data, which includes information about exceptional events. The data we received includes all air monitor readings flagged for an exceptional event from Jan. 1, 2016, to Jan. 31, 2022 — the most recent data the EPA could provide, as of September 2023. We received datasets of exceptional events and air monitor readings from the EPA across the U.S. that were flagged for an exceedance caused by exceptional events. The data includes the type of exceptional event and pollutant, such as those for high winds; ozone or smog; and soot or particulate matter; the local or state agency with jurisdiction over the air monitor; a text description of the event; and whether the EPA agreed to exclude the data from its calculations.
To help journalists and the public explore Environmental Protection Agency data we obtained and analyzed for our “Smoke, Screened,” investigation we have published the raw data and code in a GitHub repository.
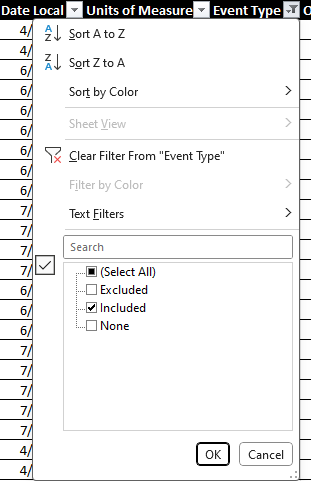
We have also published the data in a more user-friendly way through a tool called Datasette. If you click on the link to our Datasette of exceptional events data, you will be able to see a map of all EPA monitors flagged for exceptional events. From there, you can toggle, or “facet,” to view the data by different categories and organize it, by state, type of event (Canadian or U.S. wildfire, high winds) or type of pollutant (particulate matter, ozone).
In a webinar with the Society of Environmental Journalists, we demonstrated how to explore the data in Datasette to kick-start reporting on exceptional events. You can also refer back to our GithHub for a more in-depth dictionary of EPA terms and description of our methodology.
In addition to the data we received on exceptional events, the newsrooms filed state open-records and federal Freedom of Information Act requests for emails, contracts and written “demonstrations’‘ for exceptional events. Local air agencies submit a written demonstration to the EPA to formally ask the federal government to agree to exclude some or all of the data that the agency has flagged. In response to our open-records requests, we received 138 demonstrations submitted to the EPA from Jan. 1, 2016, to Feb. 15, 2023.
Because the EPA doesn’t collect all of these demonstrations in one place, nor connect them to the AQS data about the events, we cannot ensure that the 138 figure represents all demonstrations for this given time period. However, it closely mirrors the number of events that the EPA issued a decision on in the data we received.
We also consulted with five atmospheric scientists who have experience studying air pollution and its health impacts. As we received data and documents from the EPA, these experts helped shape our methodology. Once we finished our analysis, we shared our findings with them, to help validate and interpret the data. In collaboration with one of these experts, Dan Jaffe, a University of Washington-Bothell professor of atmospheric and environmental chemistry, we will present our work at the annual American Geophysical Union conference.
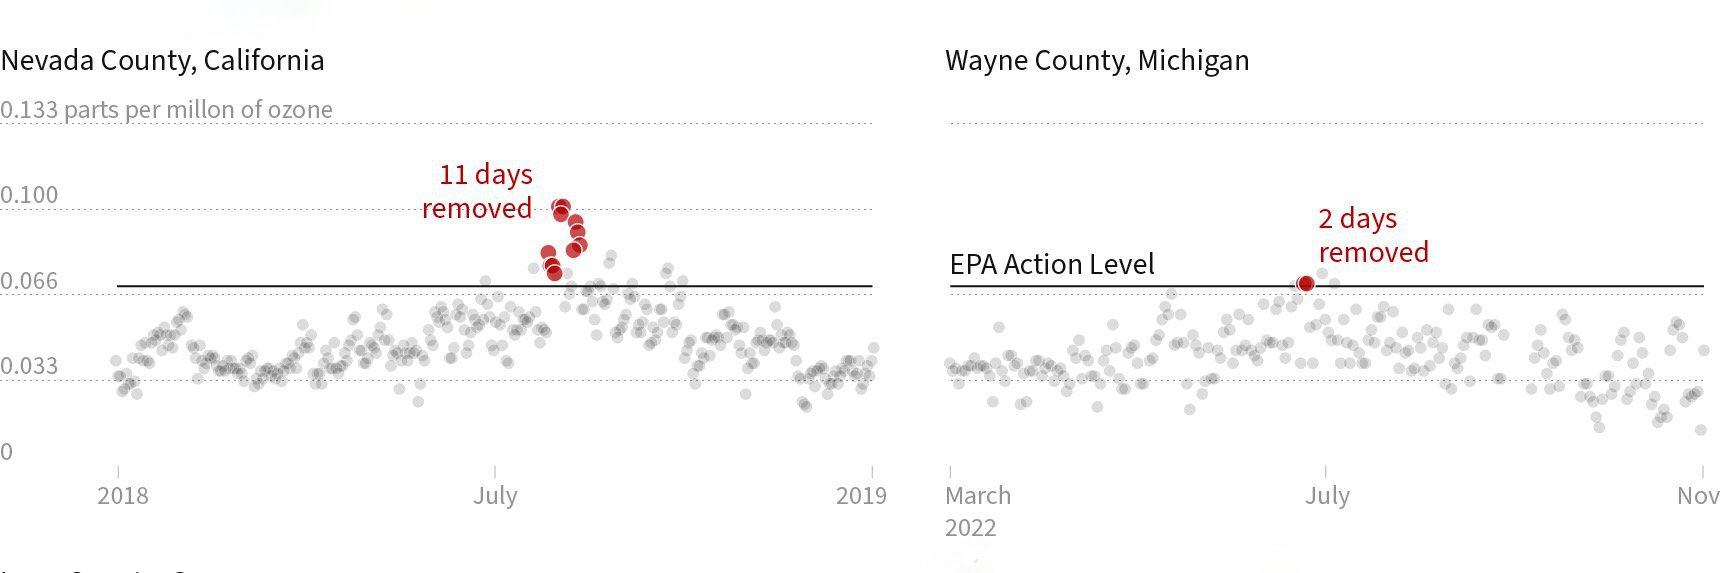
Finally, using the EPA data we received, we developed a new metric — “county-days” — to compare the amount of high pollution days removed from the regulatory record in a particular county or state. For any single day in a county where the EPA agreed to forgive pollution at any number of monitors, we counted one “county-day.” This method makes comparing exceptional events and their impact on potential regulatory decisions easier to translate across counties and states.
You can read a fuller description of the methodology we developed to analyze these data and documents in our GitHub repository.
The lead reporters on “Smoke, Screened,” are Molly Peterson of California Newsroom and Dillon Bergin of MuckRock. Emily Zentner of California Newsroom and Andrew Witherspoon and Marcus Peabody of the Guardian contributed data visualizations. Editing and fact-checking was done by Adriene Hill of California Newsroom, Derek Kravitz of MuckRock and Eline Gordts of the Guardian. Holly J. McDede and Lindsay Shachnow contributed research.