Updated June 9, 2023
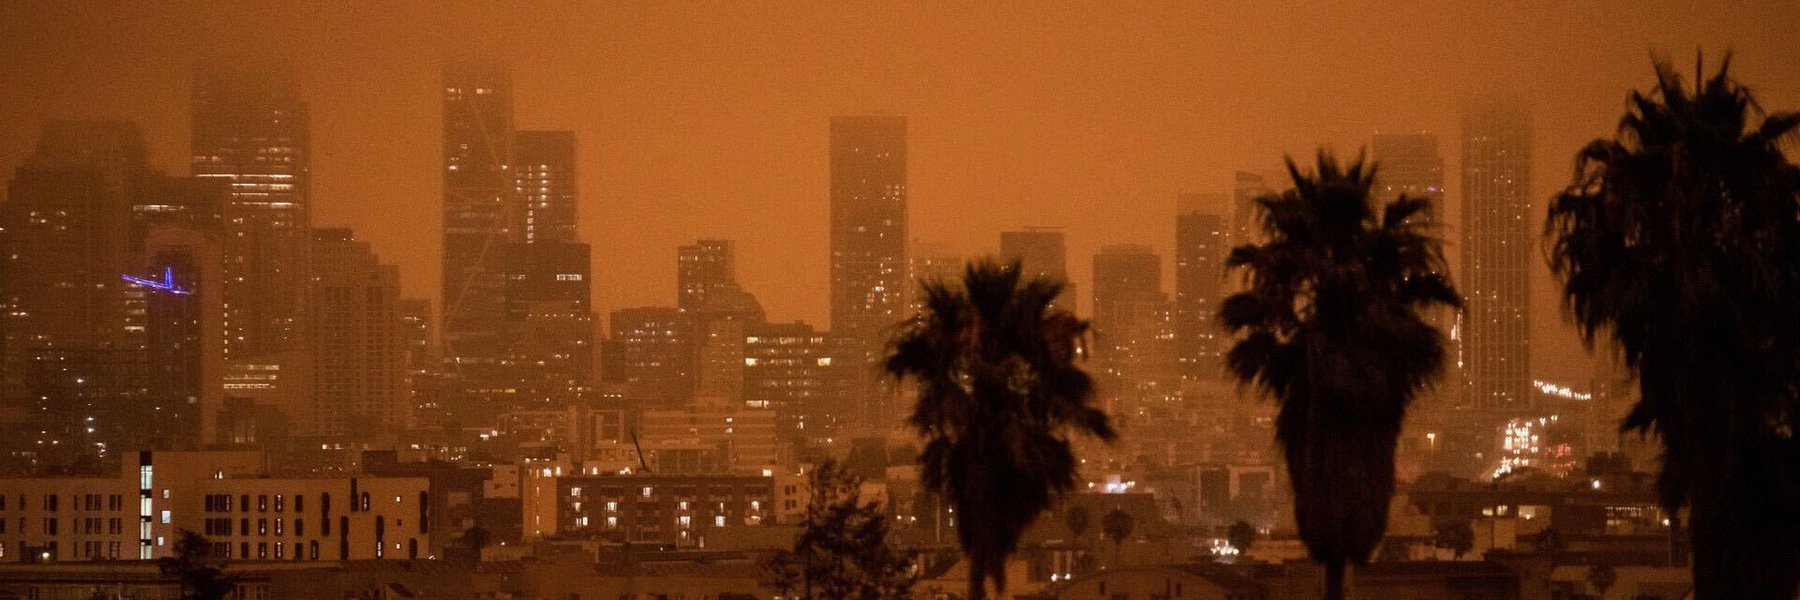
Smoke stemming from hundreds of burning wildfires in Canada has made its way to the northeastern U.S., where it is now clogging the air and causing a significant drop in air quality. New York City is now leading the ranks as the world’s most polluted city, with the worst air pollution readings seen in decades.
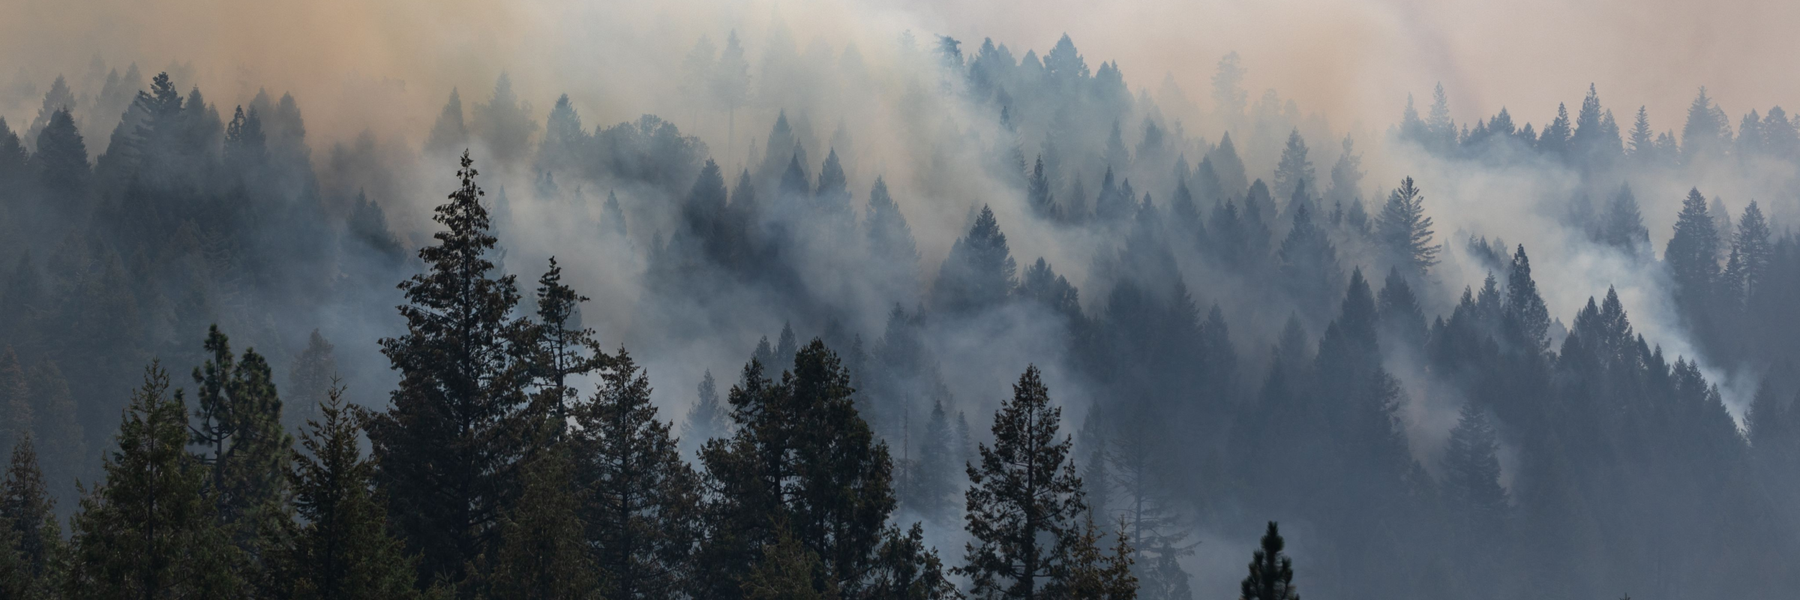
Wildfire smoke is one of the fastest-growing sources of air pollution in the United States. Particulate matter pollution from fires can cause significant health complications for those that are pregnant, young children, the elderly, outdoor workers, residents of leaky buildings and anyone with heart or lung ailments.
MuckRock has spent the past two years working on various air pollution journalism projects, including analyzing pollution data and installing our own air sensors in Chicago and digging into wildfire smoke data in California.
Here is a collection of MuckRock resources, including a data archive of historic U.S. wildfires from the National InterAgency Fire Center; how-to guides on what type of documents and data to request from local governments; and live PurpleAir sensor data from Chicago and New York City to help newsrooms, civic groups and the public make sense of wildfire data.
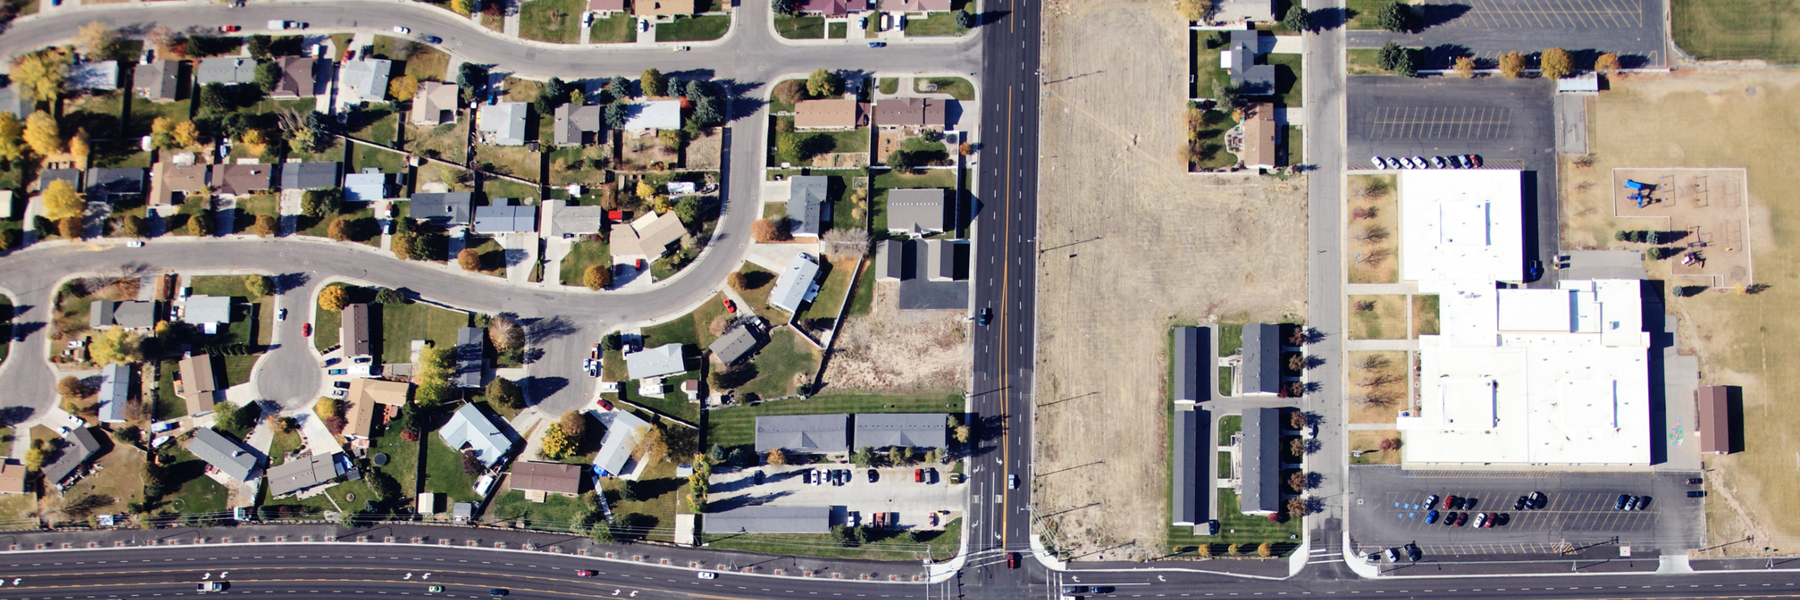
What documents and data to request about air pollution from your local government
MuckRock’s “Air Quality Access” series offers guides to help you investigate air quality in your community using public records requests.
This guide includes advice on:
-
Finding your local air pollution control board or air pollution branch of your state’s environmental agency and knowing what documents to ask for, including air pollution permits, annual air pollutant reports and new source review permits;
-
Asking your local government how it regulates polluters in your area, including requesting initial complaints, sustained violations and monitoring reports;
-
Asking what your local government is doing to improve your air quality beyond issues of compliance or how polluters ended up in your community in the first place.
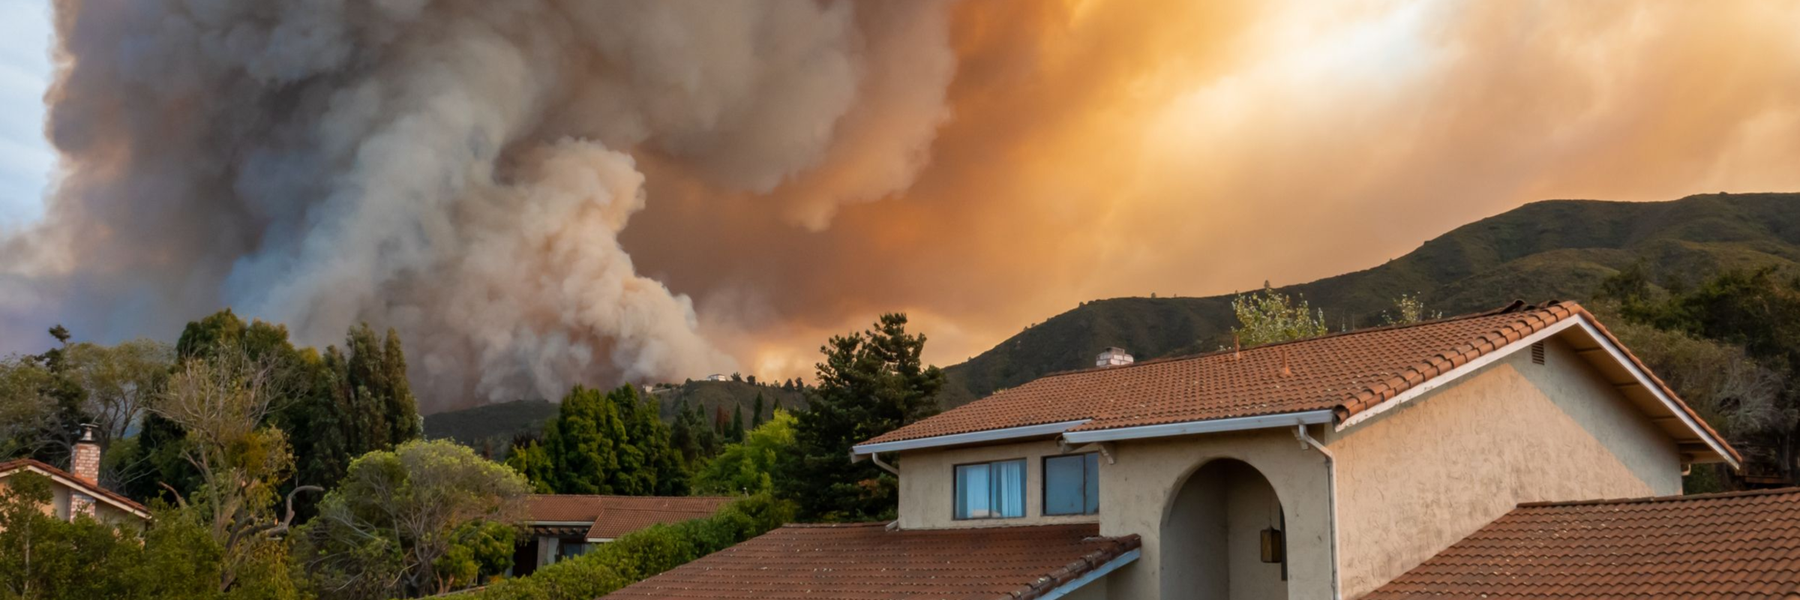
Explore our EPA wildfire data, including historic U.S. wildfires
Our EPA wildfire data on GitHub contains data and findings that are part of an ongoing collaboration between MuckRock and the California Newsroom on the increasing impact of wildfire smoke on Californians’ health. The data and analysis underpin the visualizations and findings in the story “As Wildfire Smoke Worsens Public Health, Government Watchdog Calls EPA Response ‘Ad Hoc’”.
MuckRock also provides a GitHub repository for data on the increasing impact of wildfire smoke on Californians’ health.
Additional MuckRock Resources
“What’s in the air?” from MuckRock, WBEZ and the Chicago Sun-Times offers an illustrated explainer of particulate matter, which consists of very small particles suspended in the air we breathe. The explainer highlights how high levels of particulate matter can lead to health issues like asthma, heart attack or chronic obstructive pulmonary disease.
How You Can Monitor Chicago’s Air Pollution Hotspots on GitHub contains tools to help Chicagoans stay up to date on the city’s air quality and is part of an ongoing project by MuckRock.
As part of its project to monitor air quality in Chicago, MuckRock also provides real-time readings from a PurpleAir sensor in Cicero, which has some of the highest levels of particulate matter pollution.
Recently, MuckRock has alsoinstalled a PurpleAir sensor in New York City, which saw its air quality drop significantly due to smoke from the Canadian wildfires.