Sam Sinyangwe is a policy analyst and data scientist with Campaign Zero focused on helping activists across the country better understand and address police violence in America, particularly within communities of color. Until a few months ago, he had never filed a public records request, but as part of his ongoing data work, he took part in a massive campaign to request Use of Force reports and police union contracts from hundreds of police departments across the country. Sam explains what his data-driven activism and how public records are helping reshape conversations across the country.
I want to start with what the data landscape was like before you started looking at policing issues. Were you surprised coming in and seeing how poor the data collection was?
I wasn’t surprised, but it was disappointing, to say the least. Particularly given the importance of this issue and how it really has catalyzed people all across this country to take action, and the fact that data was not being collected in a comprehensive way really showed the level of importance that the FBI, CDC and the Bureau of Justice Statistics really placed on this issue, given the fact that they’re collecting comprehensive data on things that are much more minute and much less important than this. That was something that was a huge challenge, but something that ultimately we figured out a way to overcome.
Tell me about that overcoming. What did you decide was the best way and what kind of considerations went into the approach you took?
An article on FiveThirtyEight.com came out looking at two databases, the Fatal Encounter database and the Killed by Police database, and did an audit of the database showing that it was 100 percent accurate. Then the fact that there were about twice as many records in these databases as the official statistics showed that in fact there were those data sources out there that could approximate comprehensive data. They just weren’t the official databases.
At that point, the challenge for me was the data that is available, according to the best research estimates, is about 90 to 95 percent of the total number of people killed by police in this country every year, but it wasn’t really acceptable to people that the information that was hidden and that the data wasn’t made plain enough that activists could use it, could start to shed light on what was really going on.
What I did was merge the databases that existed to create a more comprehensive set, then started filling the gaps. There were huge gaps around the race of the victims. About 40 percent of the time they did not identify the race. I went and searched obituaries, social media profiles, criminal records databases, in order to identify those remaining records that didn’t have a race. I was able to identify over 90 percent of the folks in the database through that method.
What did you see as the most useful or high impact part of that work? Was it just making it more visible?
Making it accessible is huge.
I think at the time that we released Mapping Police Violence, the national discourse was really a debate between whether Mike Brown and Tamir Rice and Freddie Gray were isolated incidents or part of something that was more of a pattern of police violence, particularly against black folks in this country.
With the map we released, it doesn’t take you longer than two seconds to realize this is happening much more often in many more places than you would suspect. I think that really was very important to actually establishing a national crisis, and that people all over this country have a responsibility to fix it. That visual element was really powerful.
I think the second piece has to do with the way that we use data to combat false narratives. For example, this narrative that police violence is a function of police being in high crime areas and using deadly force because they are in high crime areas. “The real issue is black on black crime.” That was the narrative. Once folks were convinced that this was a national crisis and that something was going on that was killing a lot of people, particularly black people, then they shifted to try and explain it away.
What we did was we used the data to actually show that crime rates in cities really have no correlation to the rates of police killings in cities. There are cities with high crime rates where police are killing people at very high rates, and there are cities with high crime rates where police are not killing anybody. For example, in Buffalo, New York, Newark, New Jersey. The same is true about some areas with low crime rates.
When you were collecting this data, did you find that there was anything you did that helped push back against these narratives?
I didn’t really know how much this would resonate with folks. My goal was, how do we get this out there? What is the minimum viable product? Because this is a shifting conversation. It’s happening nationally, evolving rapidly. We want the data out as soon as possible and we weren’t able to code for everything off the bat. We really focused on what are the key columns of this information that can help add value to the conversation? That really was the name of the folks who were killed, the race of those folks, the gender, the location, the agencies responsible and whether they were armed or unarmed.
The first release was limited to that information because we needed to get it out as quick as possible. Indeed, when released it, it was right before the Baltimore uprising.
As that uprising took place, we were able to use the data to really show, for example, that in Baltimore, every single person the police had killed over the past year and a half had been a black man. There was a context to what was happening that was bigger than Freddie Gray and is more systemic about how the police department was interacting, particularly with black men. That was how we started. I think as the national conversation evolved, we added new columns of information to add value to that conversation.
That was how it evolved, and we continue to do that. Right now, we’re looking at who are the prosecutors involved?
In two or three percent, officers are actually charged with a crime after a police killing. The question is, who are the prosecutors leading those cases and what is it about these prosecutors that presumably have encouraged them to actually ensure that this is prosecuted? What we’re finding is that many of these prosecutors are actually black prosecutors — who are only five percent of prosecutors in this country.
After using publicly available data for the first part, why did you think it was time to start filing records requests?
With police killings, it was a situation where we couldn’t even trust the information the police department would give us if we filed a request about police killings. And so much of this information was already open source and available that we could find it online.
We didn’t have to do much for that information. But for use of force policy and police union contracts, so often that was just not available online. Even if it was, we couldn’t be sure whether that was the most up to date version.
We needed to submit FOIA requests to get access to those documents. Ultimately, this is the natural evolution of this work, is that first we look at the outcomes. What is happening to people in terms of police violence?
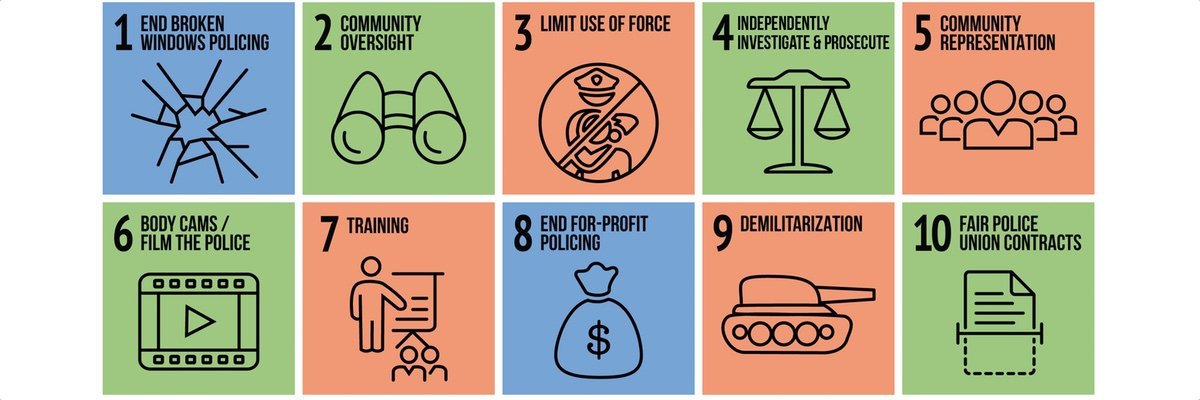
Then the question becomes why? Why is it that certain police departments are killing people at such high rates and others are not? What is it about those departments? What is it about their policies that are influencing these decisions and the way that officers interact with civilians? That’s where we really need use of force policies and police union contracts, which speak to the level of accountability and potential barriers to accountability that are embedded in the system in these places. That’s really what we’re looking at now.
Ultimately, it will be comparing those two data sets. We know now which police departments use of force policies lack common sense protections against police violence. We know which police union contracts impose really strong barriers to actually interrogating and getting to the truth of what happened in the case of police violence. The next question is are these police departments with these types of policy barriers the ones that are killing people at such high rates?
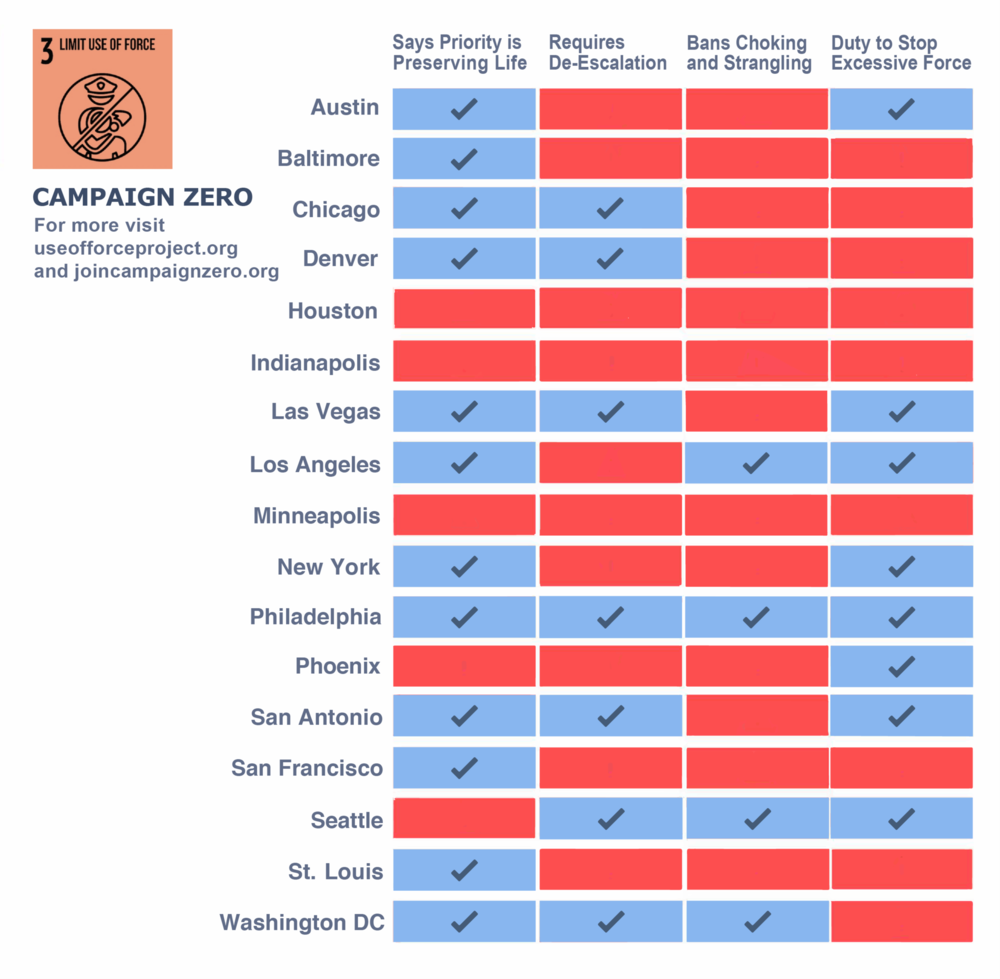
How do you think it’s gone so far, just getting something that should be a pretty basic document, like the use of force policies?
It’s actually gone really well. I didn’t know how police departments would respond to these requests. I don’t put a lot of trust in the police. I was actually surprised that we got back as many documents as we did. Now there were some departments that just refused to give us documents or redacted huge pieces of the documents, but overall, the majority of departments that we requested the documents from gave us the documents, and did it in a reasonable time frame. That was good. I think because of MuckRock, it really enabled this process to happen. I can tell you without it being as easy as it is on MuckRock, there’s no way I would have gone through all of that work to submit these requests.
You have a background in activism. You also have a background in data and analyzing data. How does your activism inform the data scientist part of you and vice versa?
I think what I have learned as an activist is that oftentimes, policy makers and system leaders, whether they are police chiefs or elected officials or folks in academia, there are these barriers in place to actually showing the community they’re heard, institutional barriers. Oftentimes, those manifest in this idea that if you can’t prove something with data, it doesn’t exist.
What we saw and what we often see is that communities that may not have academic backgrounds or particular skill sets to do these types of analyses are unheard.
They’ll say something is happening. They’ll provide story after story to validate that it’s happening. Witness testimony. Ultimately, policymakers will look at them and say, “Well, we don’t know if this is a trend or if these are isolated incidents.”
They’ll ignore that concern. I think what that experience, seeing how does that happen again and again and again in the advocacy space has taught me why it’s important to be able to produce that data and to make it available to people, to activists. Not just researchers and policymakers, but also accessible to the mainstream in order to actually push in different ways and to push using these types of tools that can be effective and convincing policymakers to make change.
What’s next? What are the big challenges you’re tackling right now and how are you thinking about them?
One, there’s so much more that we could still learn using more data.
We have the people who are killed by police. We don’t have all police shootings. We don’t have all police uses of force policies, or data on stops, searches, arrests. All that information, right? There’s so much more to learn about the different ways in which police violence manifests in people’s everyday lives, and the why as well as what the solutions to that are.
At the same time, there is a need to actually translate this information into action and into advocacy more directly.
How do we — in three clicks or less — allow people to contact their representatives and push them to advance legislation to address these issues? Those are the types of things that I’m currently working on, as well as addressing even more questions within this existing data set.
We still don’t know, for example, which three policies are most effective in reducing police violence, right? We know what the universe of potential policy solutions looks like, but we don’t really know among those, which are the ones that really make the biggest difference. I think that is really important as well to advocacy. Trying to use the data to answer those questions.
If people are inspired and want to get involved or work on similar projects, any advice for them?
We’re in an age right now where so much information is available. The challenge is less collecting the information and more how do we make it useful? How do we make it accessible? How do we visualize it in a way that anybody can understand it and take action with it? I think that is the skill set that’s needed: How to curate all this information available online, make it available, make it actionable and actually make the change happen. I think that is something that I would encourage people to think about.
Image via Campaign Zero