What Microsoft did for its air quality pilot project
Microsoft’s UrbanAir API, which maps its air quality sensors and readings, can be found here.
Chicago has several EPA regulatory stations, considered the gold standard of air quality testing; an array of cheaper sensor networks across the city and suburbs like PurpleAir and Microsoft’s pilot project; and new satellite imagery that can detect a host of particulate matter, gaseous and ozone levels.
But previous low-cost sensor projects in Chicago failed to get enough accurate readings to draw firm conclusions, experts say. The new Microsoft data goes a step further.
Between April and July 2021, 115 sensors were installed across Chicago.
The first sensors were placed at EPA regulatory stations in May. An additional 100 sensors were installed in July, 80 of which were placed atop city bus shelters based on a random sampling of Chicago-area traffic and density data.
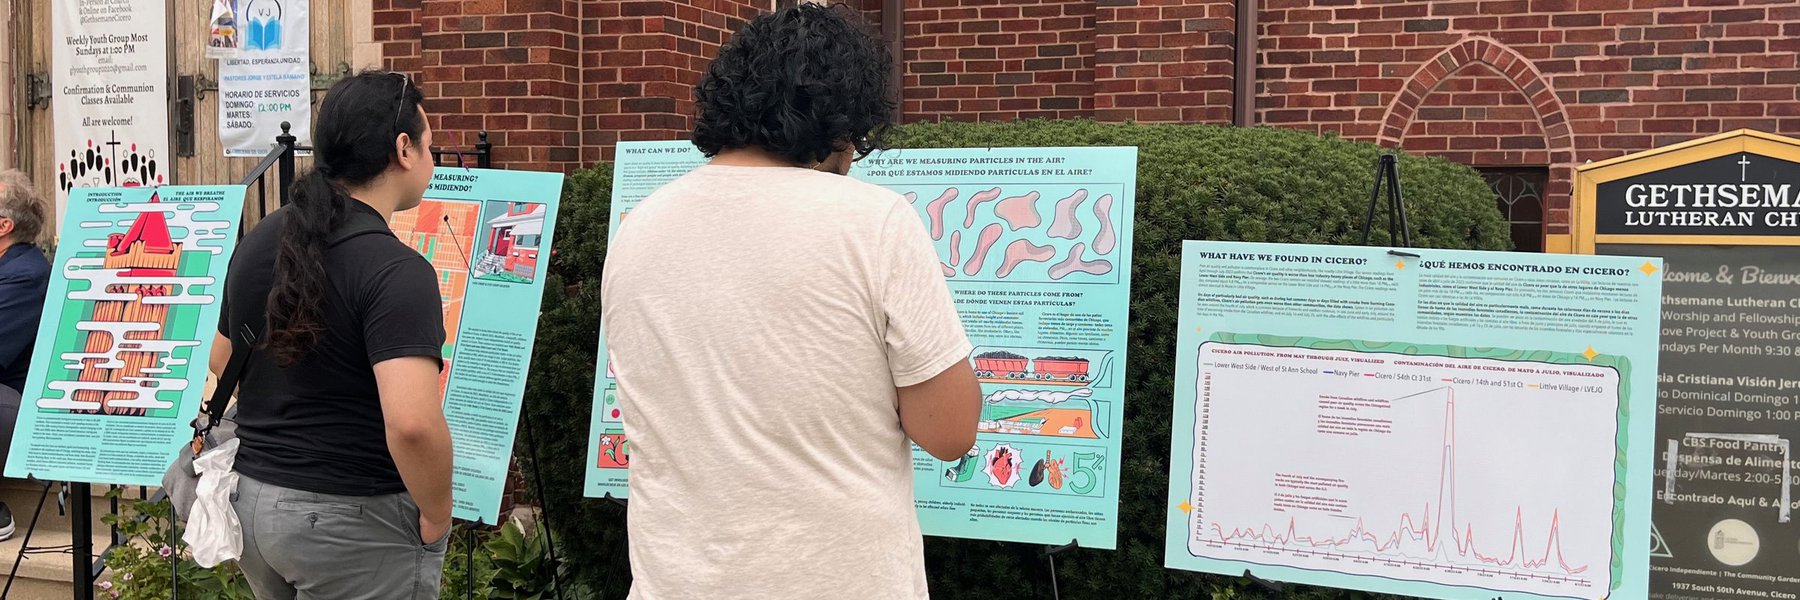
Twenty sensors were placed in coordination with environmental justice groups. Microsoft is partnered with the Environmental Law and Policy Center in Chicago, which assembled a group of community organizations to weigh in on some sensor locations including Blacks In Green in West Woodlawn, BUILD Inc. in Austin representing the border West Side, Neighbors for Environmental Justice in McKinley Park, Latinos Progresando in Marshall Square and the Little Village Environmental Justice Organization.
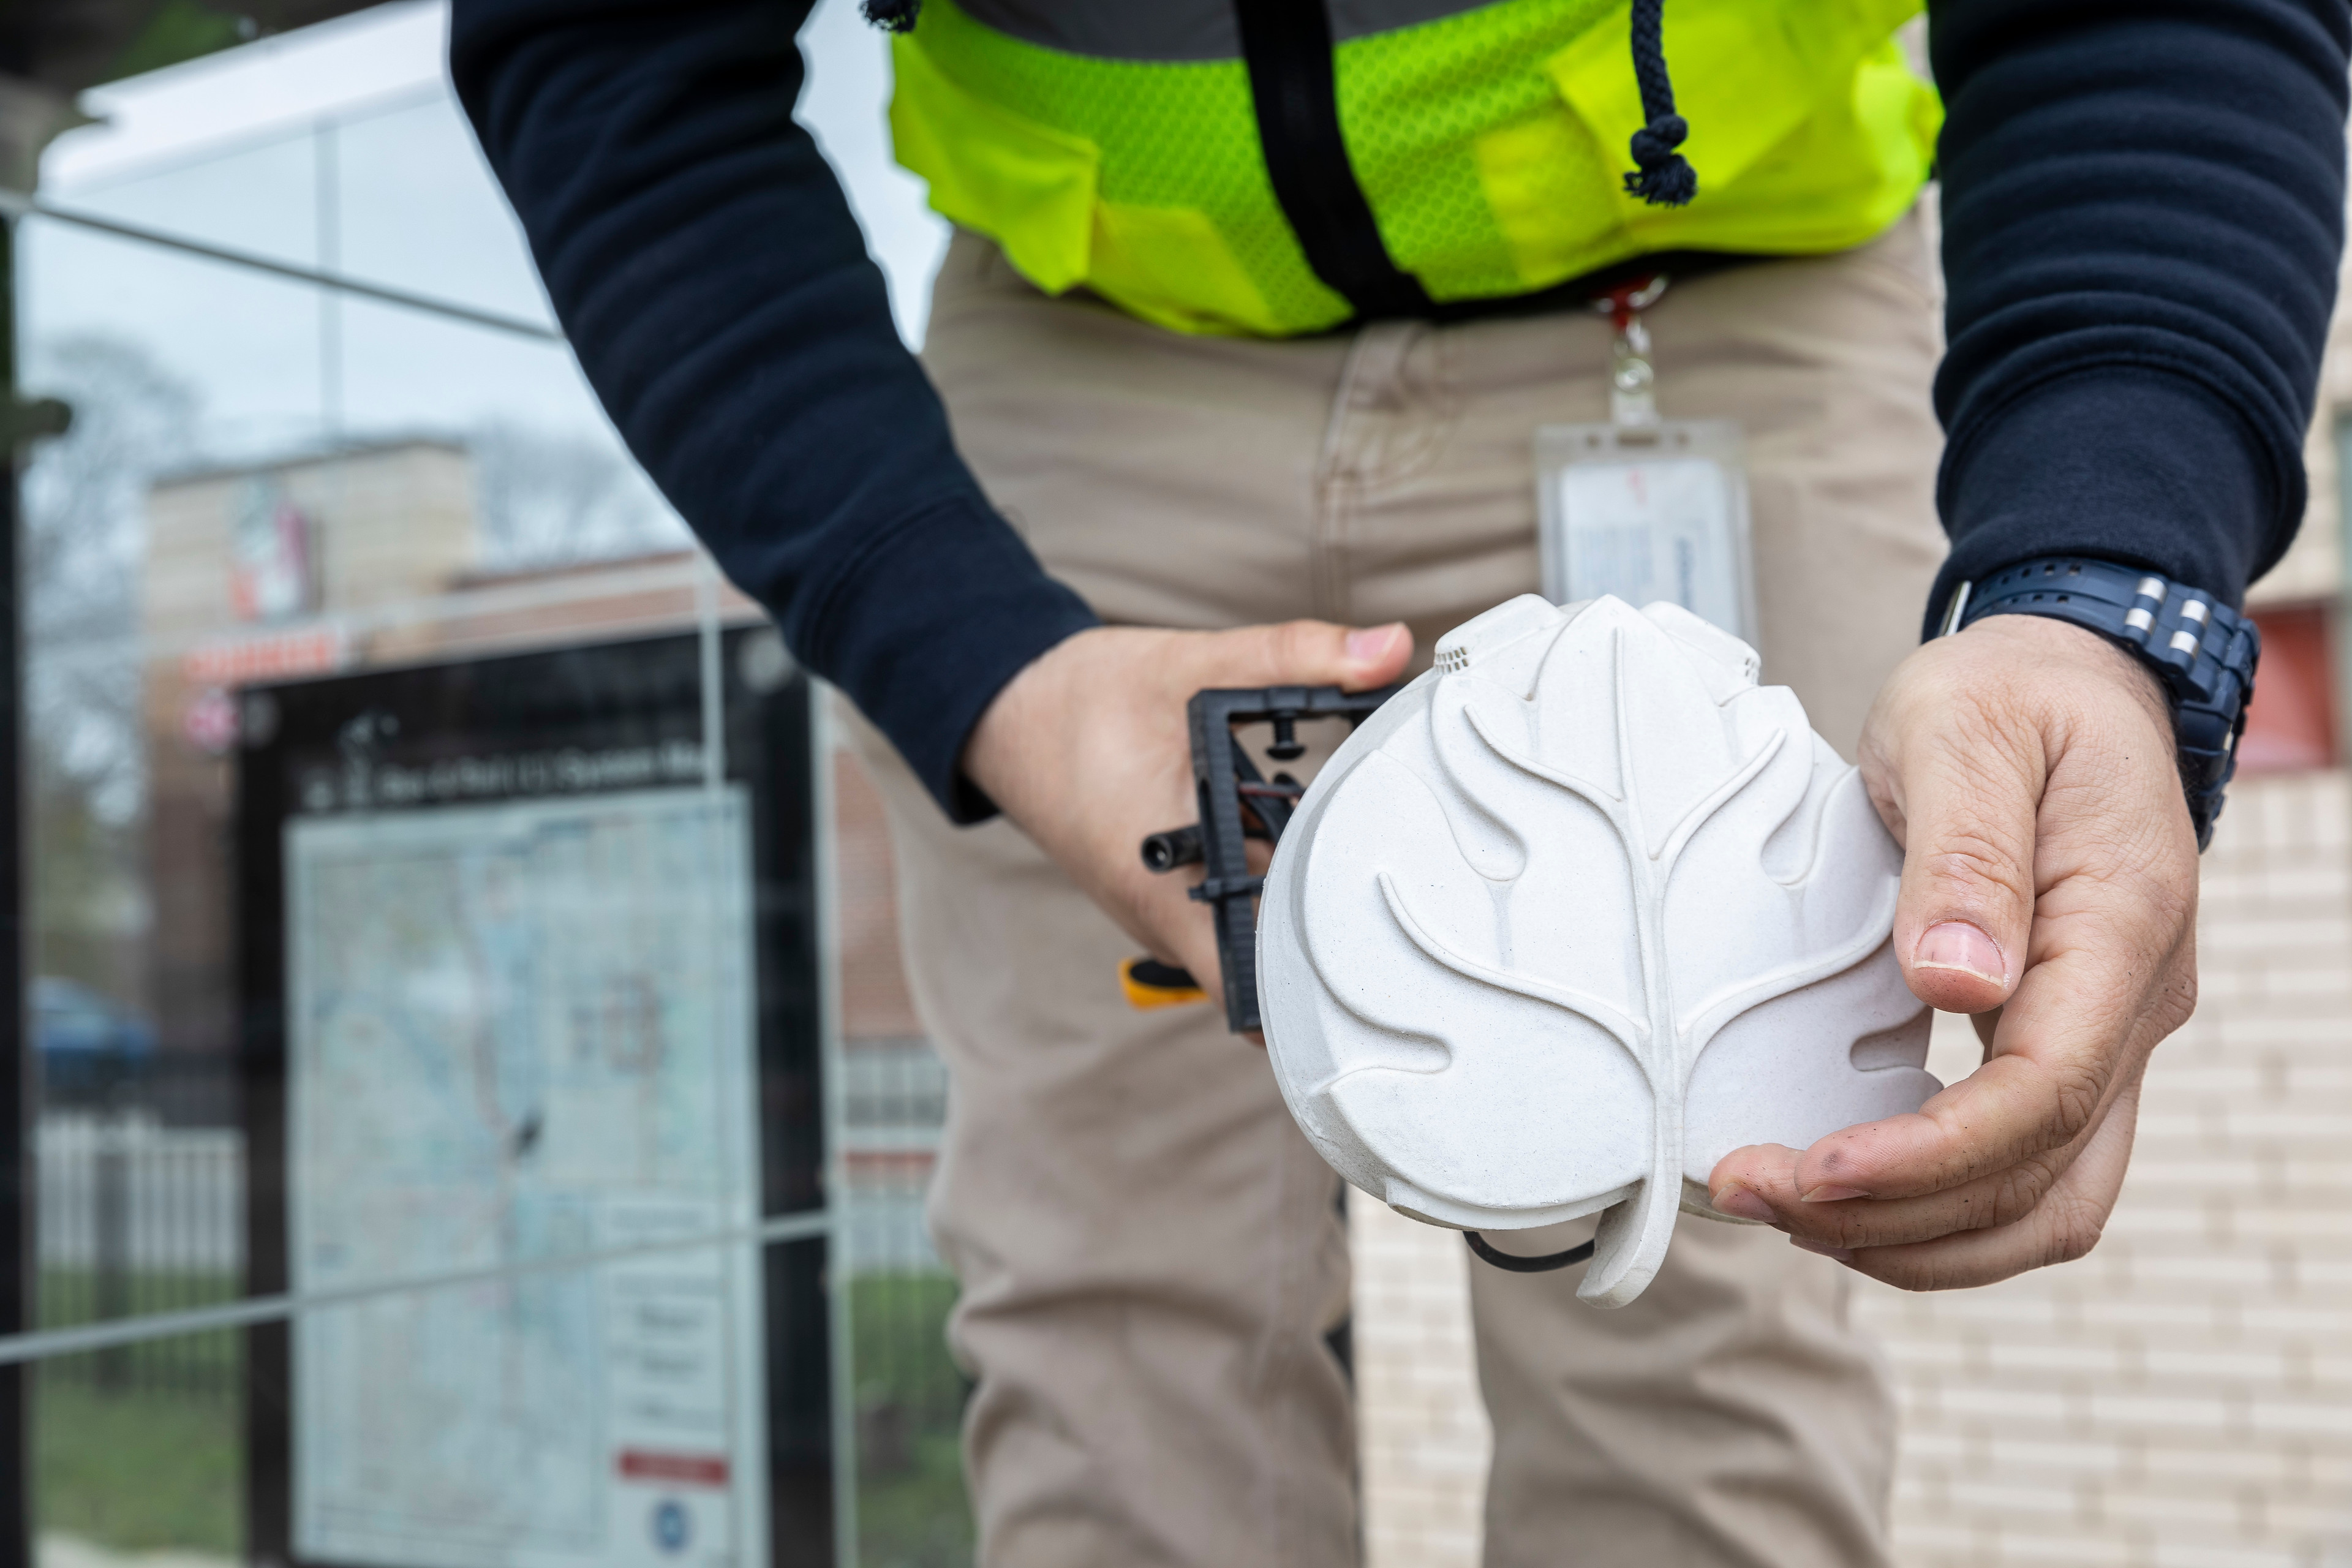
Microsoft’s leaf-shaped air quality sensors are solar-powered, cellular-connected devices that collect readings on fine particulate matter, PM2.5, humidity and barometric pressure.
They have air vents on the top and bottom and feed data using a connection to a Microsoft cloud service into a real-time website maintained by the tech company. The devices collect data on particulate matter using a Sensirion SPS30 sensor, which is among the best performing low-cost air quality sensors in lab and field tests.
But there are limitations.
The difference in data quality between the low-cost Microsoft sensors and regulatory-grade EPA monitors is large, said Zac Adelman, executive director of the Lake Michigan Air Directors Consortium. Microsoft’s calibrated +/- 29% error rate is below the EPA Air Sensor guidebook’s recommended threshold of +/- 30% but the large error rate of the raw particulate matter readings makes them difficult to rely on for hourly or daily figures by sensor.
And there have been a handful of problems during the study: Some devices weren’t able to get the cellular signal they needed. In the winter, devices — particularly those near tall buildings that block out sunlight — went into hibernation mode, resulting in lost data. In one instance, a sensor was stolen. One of the bus shelters where a sensor was located was destroyed in a car accident.
The temperature readings from the devices are largely inaccurate as the sensors overheated during hot days. The gaseous readings still need calibration before they can be used for analysis and thus were not released with the rest of the data.
But when the particulate matter readings are “calibrated” — compared to other sensors in the same network and EPA monitors for consistency — and compared to each other, they are revealing.
“What low-cost sensors tend to be good for is looking at patterns across time. Maybe the exact number isn’t right, but you’re seeing spikes or dips in the readings across time, or areas of higher or lower concentrations across an urban area — that’s what I think we’re seeing is really interesting with these sensors,” Adelman said.
The sensors can also be used to fill in gaps where there aren’t high quality expensive sensors, to identify spikes and hotspots, and to empower people with concerns about the air pollution in their neighborhoods, experts say. Microsoft said it is also working to create “a suite of analytics — including anomaly detection methods — to better enable broader accessibility to the data.”
What we did to analyze Microsoft’s air quality data
Microsoft gave us access to its Eclipse sensor data through the project’s Application Programming Interface, or API. The API acts as a pipeline to the 115 sensors around Chicago and the information those sensors have recorded for 10 months — every five minutes, every hour of the day.
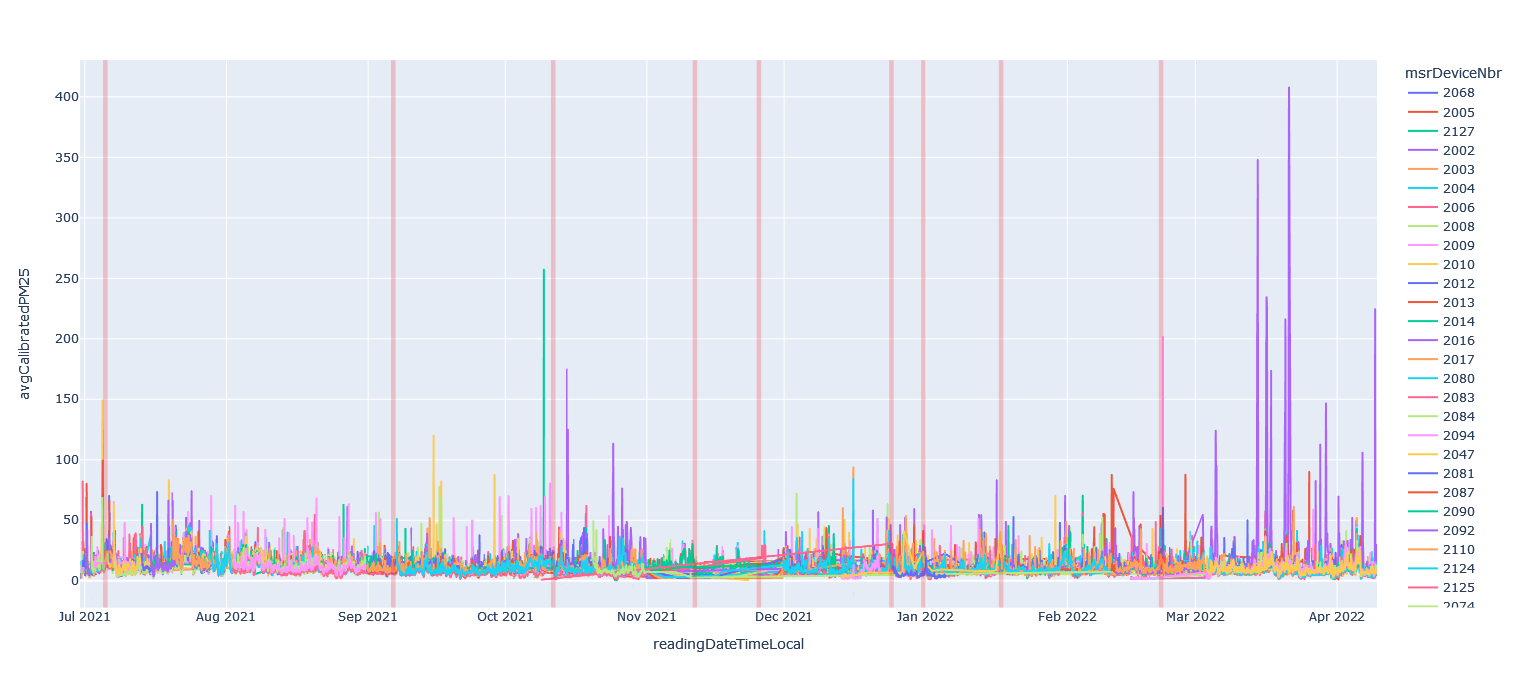
If all this data were placed into one spreadsheet, it would be more than 8 million rows.
Because of the massive amount of data, and the details in each reading, MuckRock and Columbia University’s Brown Institute for Media Innovation, WBEZ and the Chicago Sun-Times aimed not to answer all questions at once, but one critical question first:
In each month since the sensors have been installed, what areas of Chicago have been PM2.5 pollution hotspots?
To do this, reporters stored the dataset in our own database, and then averaged sensor readings by hour, day and month. At each aggregation step, a so-called “data completion criteria” was applied to match the data quality standards laid out by the EPA for Hotspot Identification and Characterization. Any sensor’s aggregated reading which had a sampling rate of less than 75% in the defined aggregation period was excluded. We also looked for hyperlocal correlations of these sensors and removed any sensor that had anomalous readings.
At this point, the collected readings still only showed the amount of PM2.5 recorded at each individual sensor.
To estimate how the reading of an individual sensor might explain pollution in specific neighborhoods, census tracts or community areas, reporters used a mathematical formula called Inverse Distance Weighting, or IDW. This is a popular interpolation technique, which makes use of the readings from all sensors at a given time, and uses those readings, based on the sensor’s distance, to estimate the level of PM2.5 pollution in regions between sensors.
The reporters used this technique to estimate air quality levels at more than 50,000 uniformly distributed geocoordinates in the entire Chicago region and then generated tract level aggregated estimates. These estimates were then normalized based on the average estimated air quality in Chicago.
While IDW is a popular approach for modeling the spread of pollution in neighborhoods, estimates are not as accurate in regions with few nearby sensors. Microsoft’s research team also cautioned that interpolations outside the edges of the sample, like those in Cicero, will be more uncertain because the network was designed for the city of Chicago.
Earlier this month, a project called ChiVes, housed at the Healthy Regions and Policies Lab at the University of Chicago, began visualizing weekly readings by sensor, census tract, and time of week. ChiVes has also collected dozens of sources to help scientists and community members explore environmental metrics alongside demographic, health and ecological data.